App Categorization
A Guide to Understanding and Managing Your Digital Workday with App Categories
Table of Contents
How It Works
The App Categories feature allows you to group similar apps under the same category, enabling you to combine a series of interactions across multiple apps into a single task. When working on a task you might switch between different apps frequently, which can make your timeline look fragmented and make it difficult to understand how much time you've actually spent on that task. By categorizing apps, you can see a more consolidated view of your activities, helping you manage your time and productivity. This helps provide a clearer view of how much time you've spent on a task, even if your timeline appears fragmented when viewed at the individual app level.
Setting Up App Categories
When adding a custom app, depending on your permission settings, you may have the ability to choose the Category during the setup process by selecting + Add a category.
Apps added from the Catalog will inherit the Category assigned to the catalog app; however, you can change it based on your preferences.
Managing App Categories
Depending on your permission settings, you may be able to edit and add new App Categories.
There are two ways that you can add App Categories to your account:
- Apps & Categories Page
- Navigate to the App Categories Page in your Produce8 account by selecting Apps & Categories from the sidebar navigation.
- Once on the Apps & Categories page, select the App Categories page to access the categories.

- From here, you can:
- Select + Add A Category to create a new Category.
- Click the Ellipsis (...) next to a Category to expand it and select + Add Apps to add to that Category.

- App Homepage
- Navigate to the Apps Page in your Produce8 account by selecting Apps & Categories from the sidebar navigation.
- This will take you to the Apps page.
- Search the app by typing in the search box, or scroll to the desired app and select it.
- Once on the App homepage you can:
- Add a Category by selecting + Add a Category.
- Modify the Category by selecting its current Category and you will be prompted to pick or create an option.

Categorization Metrics
There are up to three places where you can find metrics on App Categories, depending on your permission levels.
- Personal Homepage: Your Top App Categories can be found on your homepage, which will include the Category name, and time in the category. Clicking on the Category will open up the time series chart of the Category.
- Workspace Metrics: App Categories can also be found in your Workspace Metrics, which will include:
- Donut Chart Summary: Shows the portion of the day each Category was used.
- Time: The total time spent in the apps that are in each defined Category.
- Change: The difference from the average from the previous selected time frame. For example, if viewing weekly, it will compare against the previous week.
- Trends: Click on any of the Trends for the Categories to delve into the Time Series to analyze daily and weekly trends and your average use of the Apps in each Category.
- Account Metrics: Depending on your permission levels, you may be able to view your App Category metrics in the Account Metrics under the Apps Categories page. Here you can view the following:
- Donut Chart Summary
- A visual summary of time spent in each category based on the selected timeframe.
- Category Trends Graph
- A graph showing category usage trends over the past 3 months, broken down by week. This provides a historical view of how app usage evolves over time.
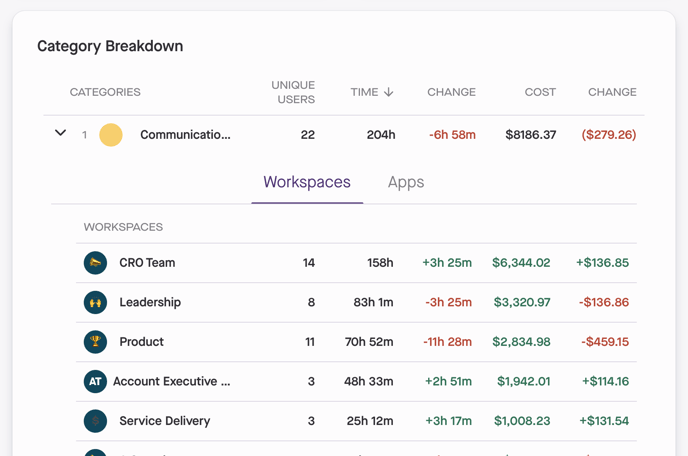
- Category Breakdown
- Unique Users: The number of users who are connected to and utilized each Category within the selected timeframe.
- Time: The total time spent in apps within the category.
- Change: Time changes compared to the previous period.
- Cost: The potential financial cost of App Category usage which is calculated by multiplying the time by the average rate.
- Cost Change: Changes in cost compared to the previous period.

- Category Time by Workspace
Click the arrow next to each category to view a breakdown of its usage by workspace.
From here you can select the Apps Tab within the category to see the specific apps included. For each app, you'll see:
-
Unique Users: The number of users who interacted with the app.
- Time: The total time spent in each app.
- Changes: Changes in app usage time compared to the previous period.
- Cost: The potential financial cost of app usage which is calculated by multiplying the time by the average rate.
- Cost Changes: Changes in app cost compared to the previous period.
-
- Donut Chart Summary


For a detailed look into the Account Metrics, click here.